The Best Logistics Data Platform: Network vs Ledger
10/5/23
Is your visualization platform limiting your effectiveness?
Let’s start with a proposition:
“You can’t optimize your network if your data is in rows and columns.”
This is because a network, such as a complex supply chain, is inherently different than, for instance, a banking transaction, which can be efficiently captured by rows and columns. Therefore, supply chain data should be stored differently than banking data. Unfortunately, most visualization systems for supply chain store data using the same ledger system as banks. Let’s look at why this can be problematic.
What is a ledger system?
Ledger systems are transactional. Events are recorded in rows and columns like a bank ledger.
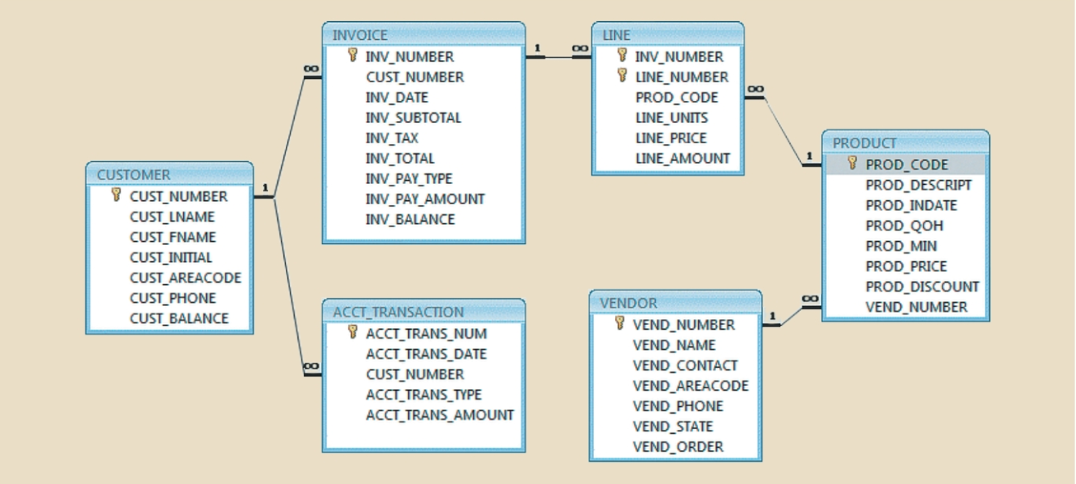
Database analysts store and query this data by creating relational databases. Relational databases store data in “tables” of related information. Tables are linked to each other through “keys”. For instance, a table may exist with customer information that has a key of Customer Number. Then a table of invoices may exist which points to the customer table by using the Customer Number field.
Relational Database Example
This allows customer information to be stored once and used many times. Data is efficiently stored and easily retrieved. As mentioned, this works great for ledger-based transactional systems. Historical data can be easily queried, and status can be shown. Chances are your supply chain visualization platform stores data this way.
Unfortunately, this works poorly for logistics networks where entities are connected to one another and parties are interested in the geographic “flow” of supply chain assets through time, not static information about discreet events. A relational database at its core is rows and columns and not easily translated to network type analysis. The most accurate data platform should model the real world and all its complexity, which a ledger system cannot do.
What is a network?
A network is a set of interconnected entities with movements between them. Goods flow between the entities and each movement and handling has a time and cost associated with it.
The goal is to get the goods from the origin (suppliers/manufacturers) to the destination (customers) within an expected departure and arrival time, with the minimum overall cost, and within service and capacity constraints.
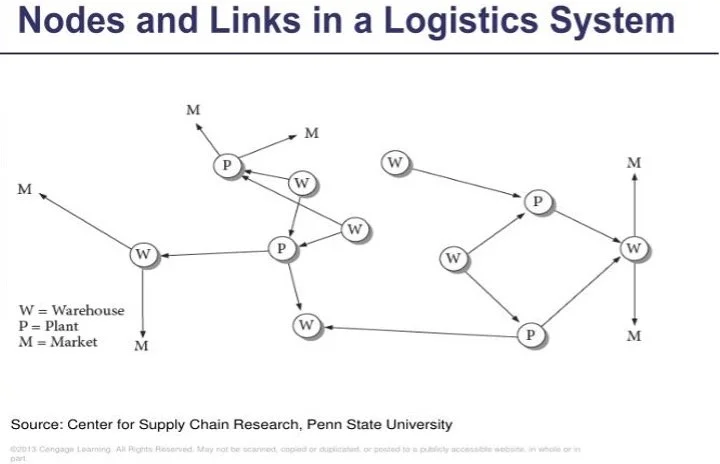
In a network, the entities (ports, terminals, warehouses, etc.) are called nodes and the connections between the nodes are called links.
Depending on how the network is connected, a node can be a gateway, hub, feeder, etc. The links can be movement on ocean, air, ground, etc. Corridors are a set of nodes and links that flow in a general direction.
As you can see, modeling a network cannot be done with the ledger-based data model. The intricateness require a different type of system and a different way of thinking. The ability to replicate the nodes and links of the real world is a must in logistics.
The nodes and links in the model above are like a map. Modeling a logistics system requires the same type of technology we all use in our navigation systems, where each intersection is a node, and the streets are links.
By modeling our supply chain in this manner, we can ask the system questions regarding the best way to move goods, just like we ask our navigation system the best way to get from one place to another. This is enabled through Location Intelligence.
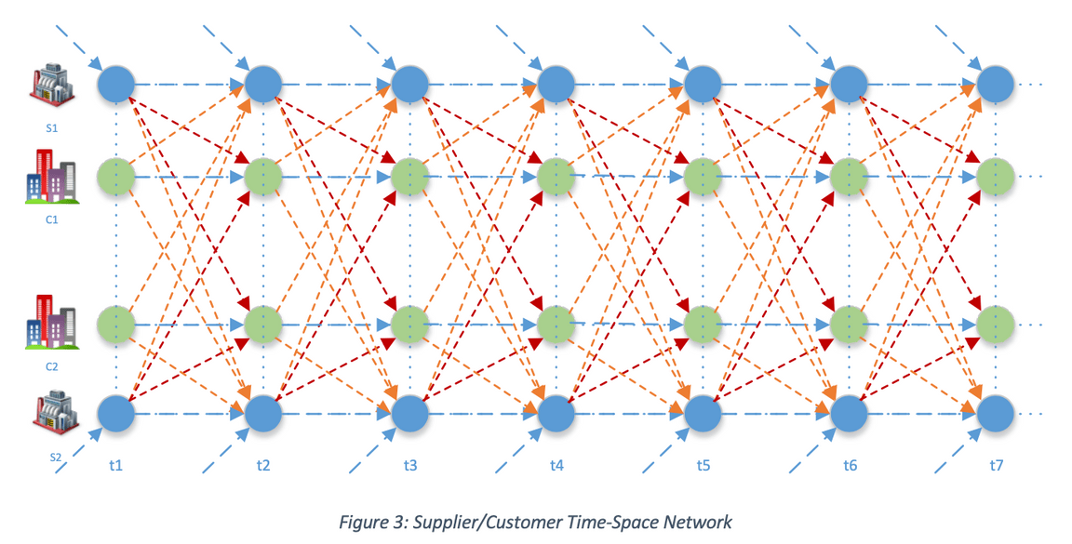
The map above shows the flow of goods spatially. However, assets move not only through space (from location to location), but in time. ESP understands the basic principles outlined here and models logistics systems through the lens of location intelligence in both time and space, providing an infrastructure to better plan and react to disruptions.
When data is modeled as described here, bottlenecks become apparent. Bottlenecks hinder the flow of resources and goods through the supply chain, causing inefficiencies and wasted time. With network data and location intelligence, bottlenecks become clear. This is not feasible to see with ledger-based systems.
Points on a Map is NOT Location Intelligence
Merely using a map should NOT be confused with location intelligence. According to “The Geography of Transportation Networks”:
“A transport network, or transportation network, is a network or graph in geographic space, describing an infrastructure that permits and constrains movement or flow.[1] Examples include but are not limited to road networks, railways, air routes, pipelines, aqueducts, and power lines. The digital representation of these networks, and the methods for their analysis, is a core part of spatial analysis, geographic information systems, public utilities, and transport engineering. Network analysis is an application of the theories and algorithms of graph theory and is a form of proximity analysis.”
This network analysis is location intelligence. Without the location intelligence backbone, assets are not connected, and we just have pushpins on a map.
ESP goes “Beyond Visualization” by not only showing where assets are, but where they are going, when they will arrive, and suggestions for the best course of action. We are used to our navigation system rerouting us around traffic and giving us travel path options. A supply chain powered by location intelligence can do the same thing to reduce costs, improve service, and resolve disruptions.
More Than Just Information
To truly model and improve our supply chain, we need to move beyond visualizing or even predicting supply chain status. While these are important “steppingstones”, they are not adequate to resolve issues. The ESP time-space network foundation is designed to support advanced machine learning, AI, and more traditional analytics to provide wisdom.
As an analogy, in the old days we all had maps in our car’s glove compartment. When we wanted to go somewhere, we had to make our own decisions on how to route to a destination based on a static map. Today, we use a navigation system that not only determines the path to the destination but can route around traffic and provide alternative options for travel. This reduces the amount of detailed knowledge the user must have and moves much of the decision making and consideration of alternative options to the system. Wise decisions can then be made more easily with more complete information.
The Network Effect
As described, a supply chain is a set of connected entities with assets that move in time and space. As such, entities are affected by one another and must be evaluated as an entire ecosystem. A supply chain cannot be optimized by looking at nodes individually. If each port, terminal, warehouse, and movement were optimized individually, the overall result would still be inefficient. In fact, arguably the largest inefficiency in the supply chain is due to not planning across nodes, causing handoff issues.
MIT Professor Dr. Yossi Sheffi describes the need to look at a network as the Network Effect. Talking Logistics paraphrased him:“the network effect exists in transportation when the addition of another shipper, carrier, freight broker, or other participant to the network makes all the existing members of the network better off — by more quickly and efficiently matching demand with supply, by executing transactions in a more streamlined and automated way, and by providing everyone with network-based business intelligence and analytics about capacity, rates, on-time delivery, and other metrics.”
ESP understands the “Network Effect” described by Dr. Sheffi and includes the ability to integrate with additional location-based data. ESP has access to over 5,000 layers of information that seamlessly merge with customer data. With the location intelligence backbone, ESP can connect to other data layers such as weather, parcel tables, crime statistics, etc., providing a truly holistic view of the supply chain.
Logistics professionals recognize that a supply chain is a network of facilities and distribution options where goods are received from suppliers and delivered as products to customers. Their objective is to minimize the total cost of movement and storage while maximizing the service to customers.
They also understand the complexities within the supply chain due to the relationships between supply chain entities. A change in one entity, such as port congestion can have a ripple effect throughout the network such as transportation and warehousing.
If the visualization platform being used has ledger-based data in rows and columns, these complex relationships are not captured in the data and therefore the user is responsible for filling in that gap. The result is a limit on the overall success of the supply chain and slow reaction time to managing disruption.
The solution is to employ a platform with networked time-space data as a foundation with an overarching advanced analytics layer sitting above. This allows complex relationships to be modeled and provides solutions which allow for an efficient, agile, and customer focused supply chain.
AUTHOR
Jack Levis, Product Strategy Officer
Jack Levis brings 43 years of logistics and technology experience and has been responsible for developing operational technology solutions at UPS and other businesses, which required advanced analytics to reengineer processes, streamline operations, and maximize productivity.
About ESP
ESP was created by combining over 20 years of supply chain and logistics expertise with technologists that have focused on the science of location and location analytics, the practice of layering geographic data along with business data to extract valuable insights. The advantage that our customers have with ESP is the ability to access and capitalize on a continuously growing infrastructure that enables more focused location-based analytics, helping the supply chain become smarter. ESP has designed a Space and Time Network which enables data (real-time, historic and near real-time) to be consumed, analyzed, viewed, and translated into action. Critical to our customers’ success, our network enables the analyzation of data sets that are beyond typical supply chain data, resulting in more accurate and actionable information.


